Group Activity: Determine the Task
Many maps are published without the context needed to read them correctly. In this activity, your group will study seven maps of the same U.S. presidential election and work out that context: what data each one encodes, how it encodes it, and what the map does and does not tell its reader.
Before you start
Read: From coronavirus to bushfires, misleading maps are distorting reality (First Draft).

Instructions
- Form a group of 2–4 people.
- Create a shared Google Doc. Add everyone’s name, and set the permissions so that course staff can access it.
- Study the election-related map visualizations below.
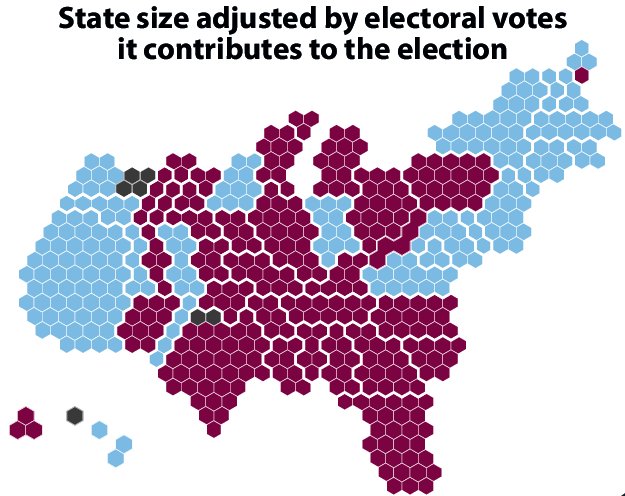
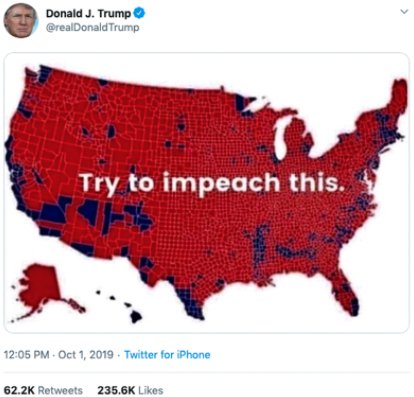
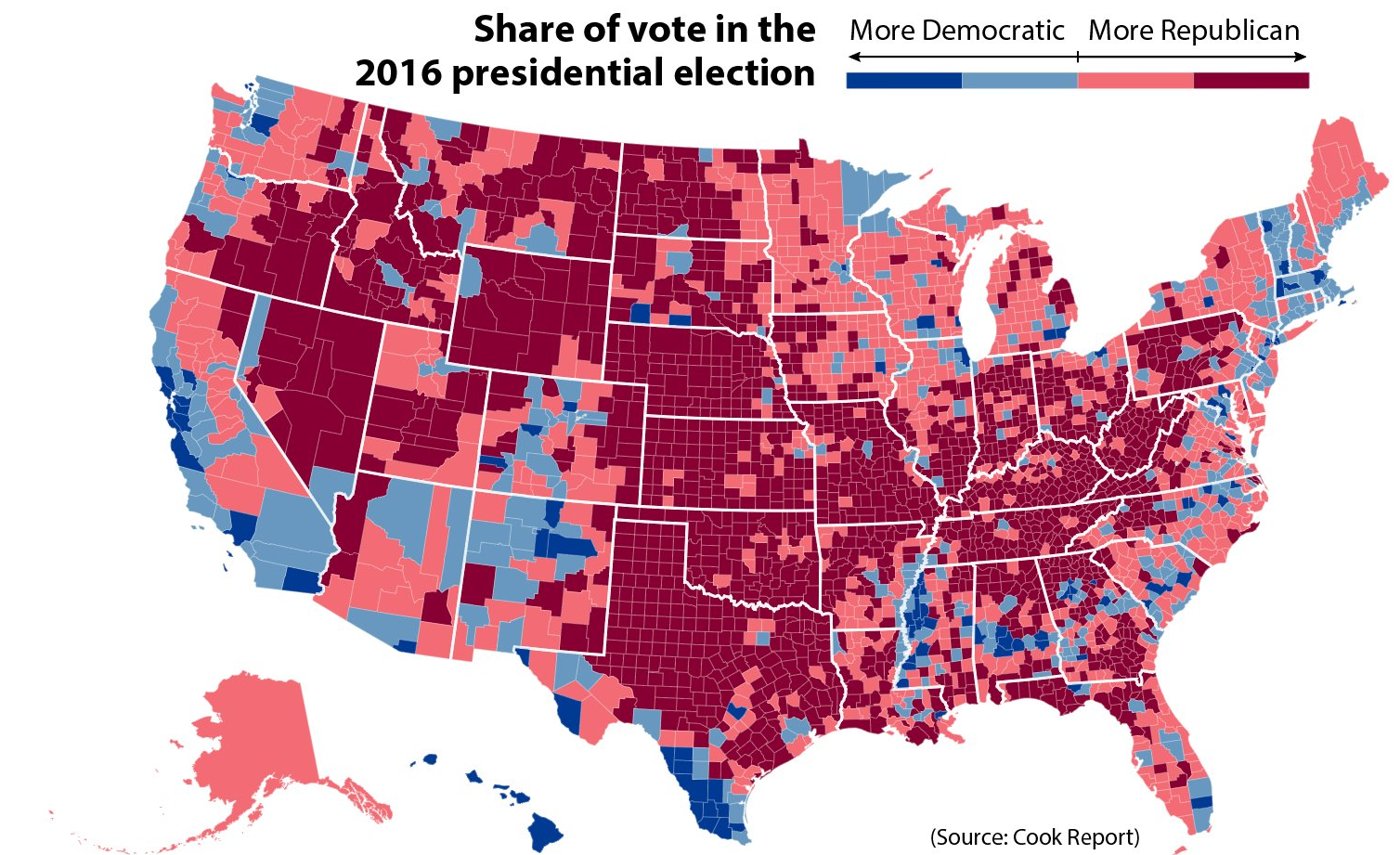
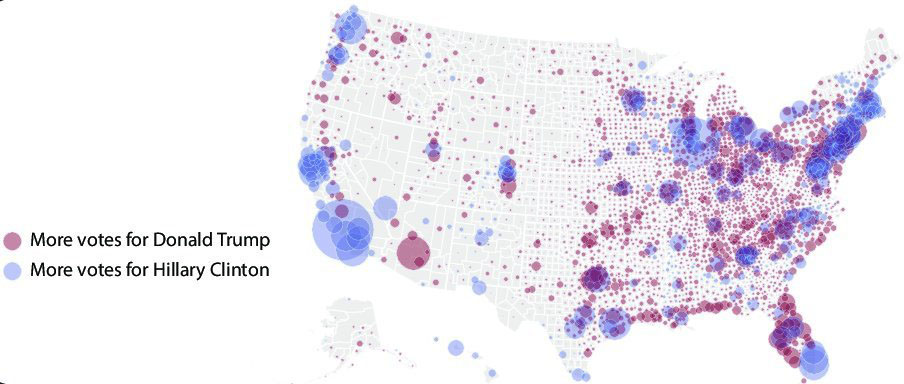
- For each visualization, write 2–4 sentences. Discuss what data are being encoded (the data abstraction and the visual encoding), and what information the visualization does and does not convey.
- Submit your document using the Google Form on the course website. One submission per group, with everyone’s names included.
A brief, simplified description of the U.S. electoral process
- Elections are run per county. Counties tally votes and report to the state.
- In general, the popular vote is counted per state, and the winner receives the state’s electors.
- The number of electors per state is determined by the number of senators (always 2) and the number of congressional districts (proportional to population).
- The 538 electors vote for the president.
Visualizations
Visualization 1
Visualization 2
Visualization 3
Visualization 4
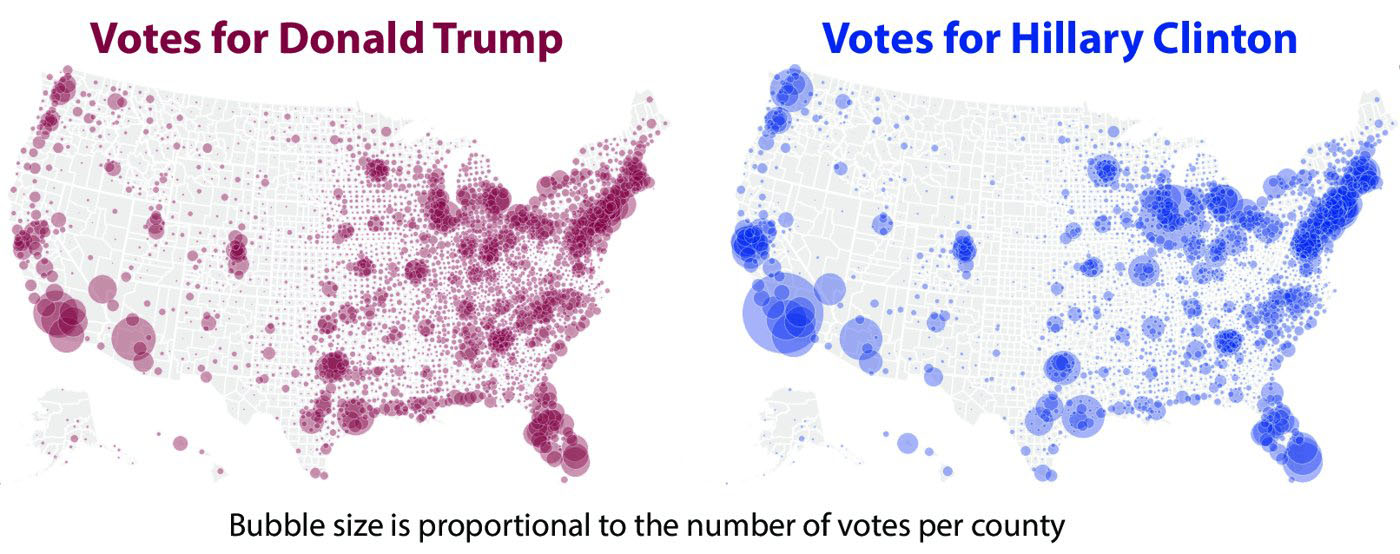
Visualization 5
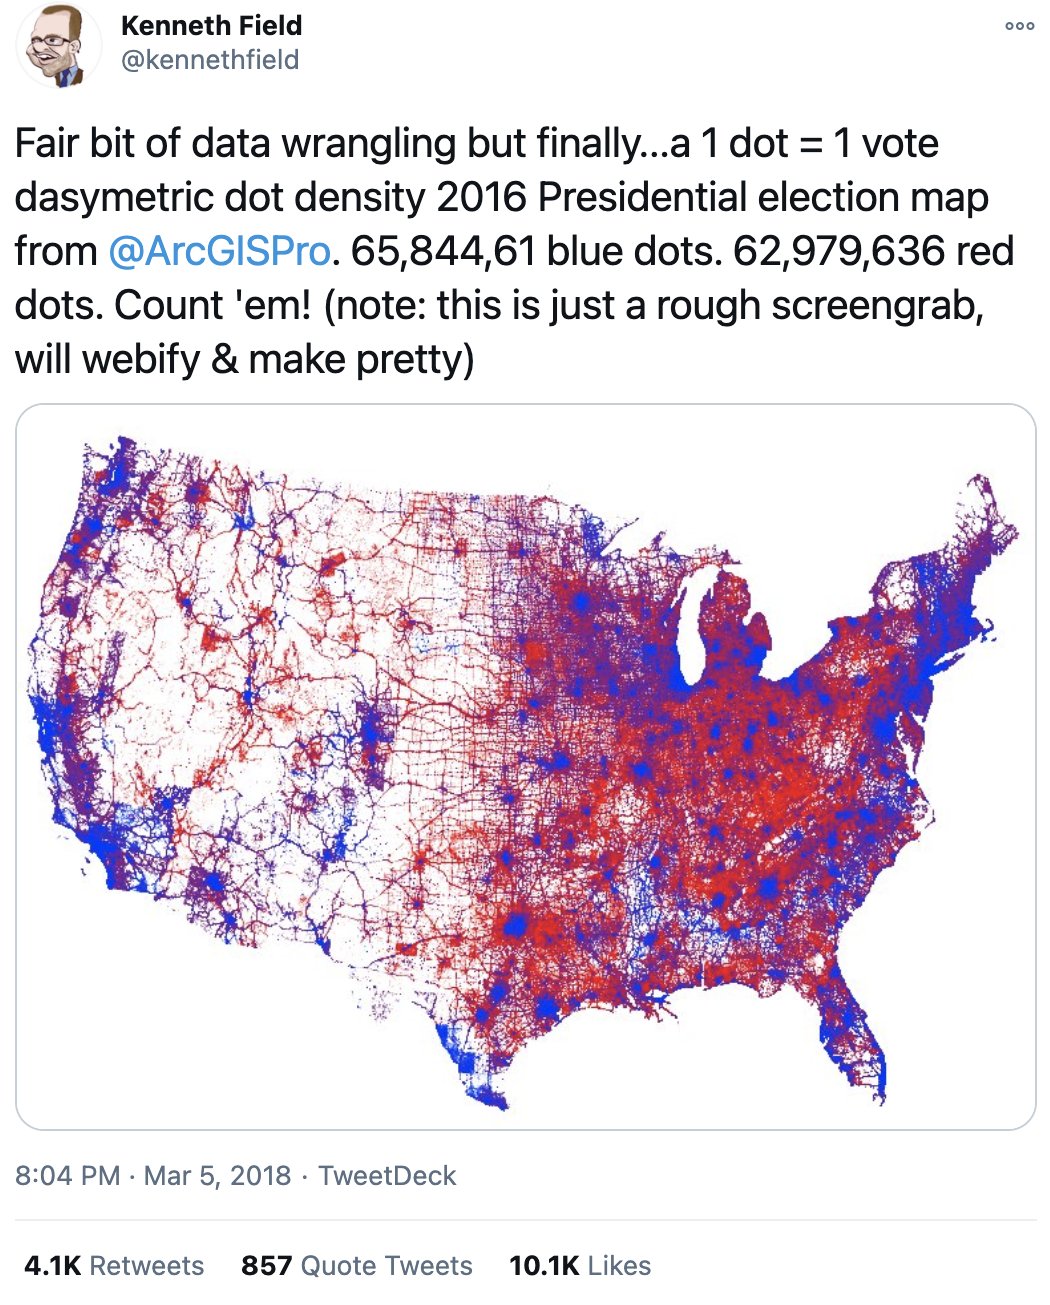
Visualization 6
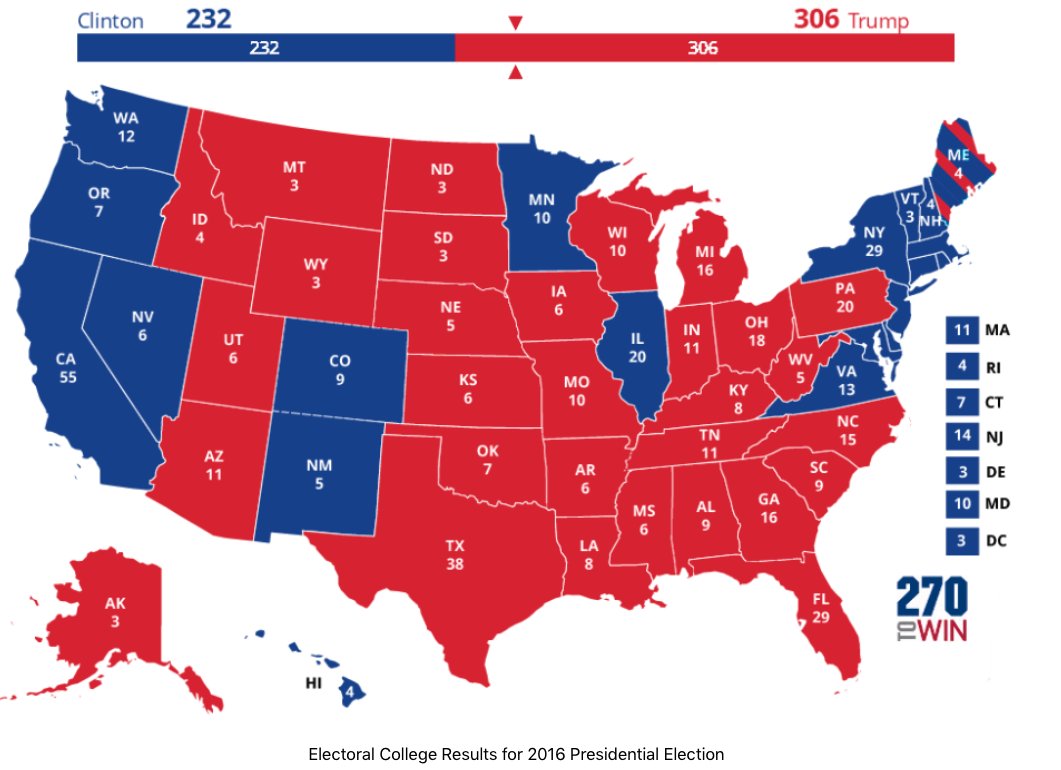
Visualization 7