
Homework 4
DS-4630 / CS-5630 / CS-6630 - Visualization for Data Science Homework 4
In this assignment you will build an interactive network visualization that allows for brushing to annotate subgroups.
Reminder: You have to use proper D3 and coding style when implementing your solution. While we won’t be testing your code with other datasets, it should generalize in principle. You might lose points for e.g., explicitly making exceptions for certain data points.
Learning Goals
The learning goals for this homework are the following:
- Working with advanced D3 capabilities, such as force directed layouts, pie charts, etc.
- Working with brushes.
- Dynamically annotating charts.
Project Structure
We have provided boilerplate code for you in index.html for the main structure of the layout and css styling in styles.css. You will be working within the script.js file that we have provided for the javascript code.
As in the previous homeworks, add your Name, UID, and email address at the top of the homework.
Create your GitHub repo, which includes the skeleton code by visiting https://classroom.github.com/a/GPu5E0MG. The project file structure looks like this:
index.html
styles.css
script.js
data/
    miserables.json
Remember that you will need to be serving the homework directory, not just opening the HTML file in a browser.
Before you submit you homework, you will want to make sure your submission is a valid html5 file. You can validate Check that it is valid by uploading it to the W3C HTML Validator.
The Data
Your network data will be in json format containing a list of nodes and links. Here is a sample of the data:
{
  "nodes": [
    {"id": "Myriel", "group": 1},
    {"id": "Napoleon", "group": 1},
    {"id": "Mlle.Baptistine", "group": 1},
...
  "links": [
    {"source": "Napoleon", "target": "Myriel", "value": 1},
    {"source": "Mlle.Baptistine", "target": "Myriel", "value": 8},
    {"source": "Mme.Magloire", "target": "Myriel", "value": 10},
...
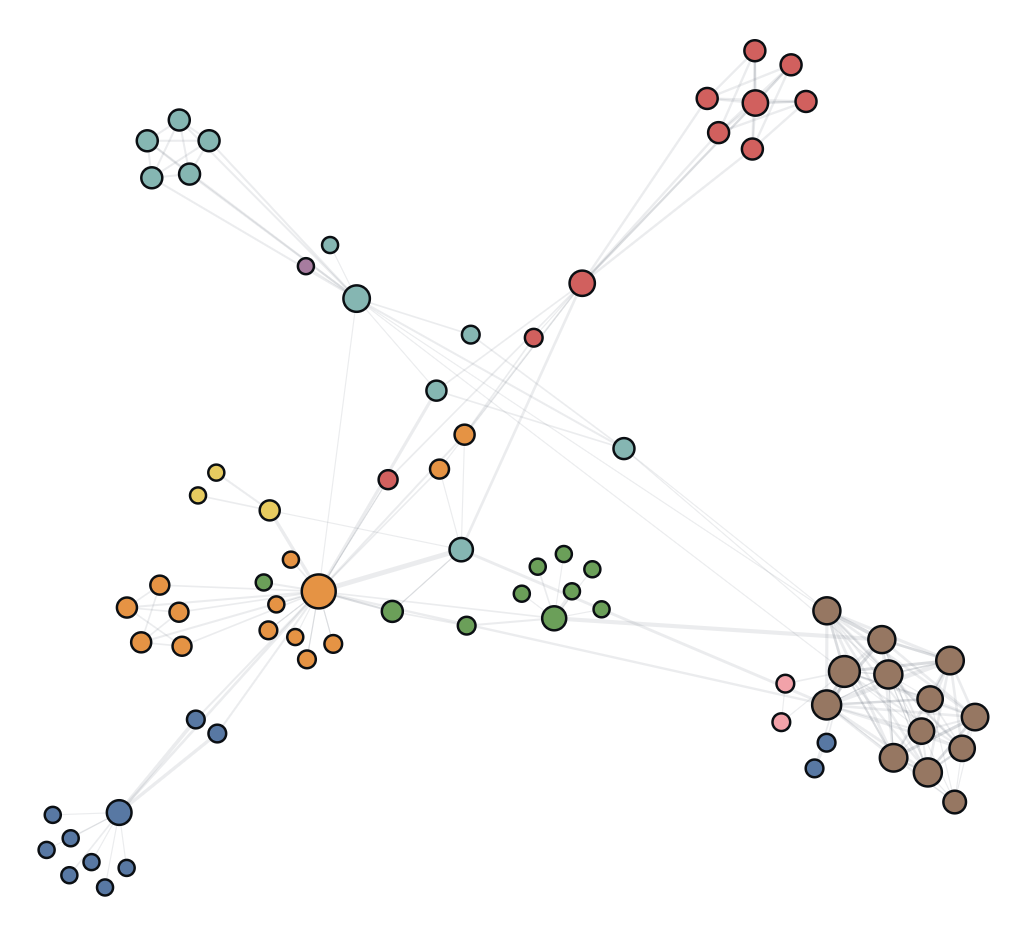
Part 1. Force-Directed Layout
For the first part you should create a force directed layout using the node and link data. See the D3 layouts tutorial for details on how to generate such a visualization.
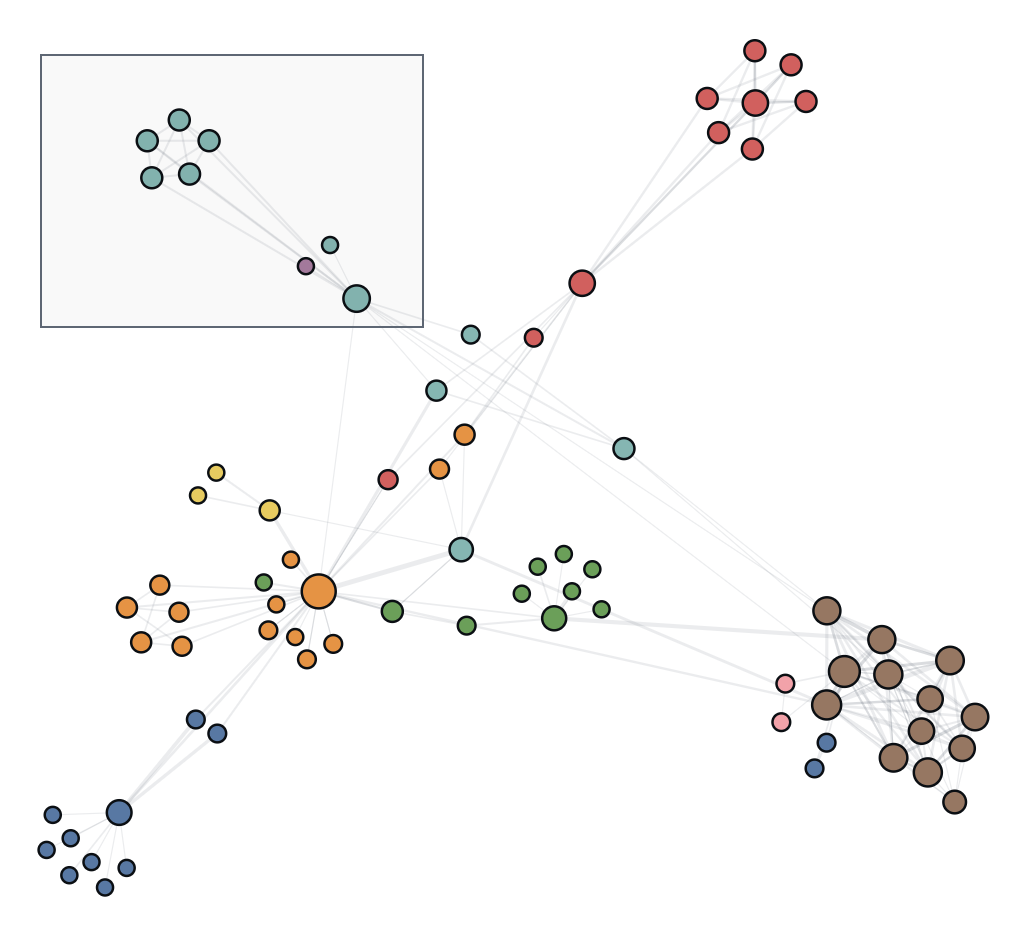
Part 2. Brushing
Next, you should implement a 2D d3.brush that will select nodes within its range. See the advanced D3 tutorial for details on how to use a D3’s brushing capabilities.
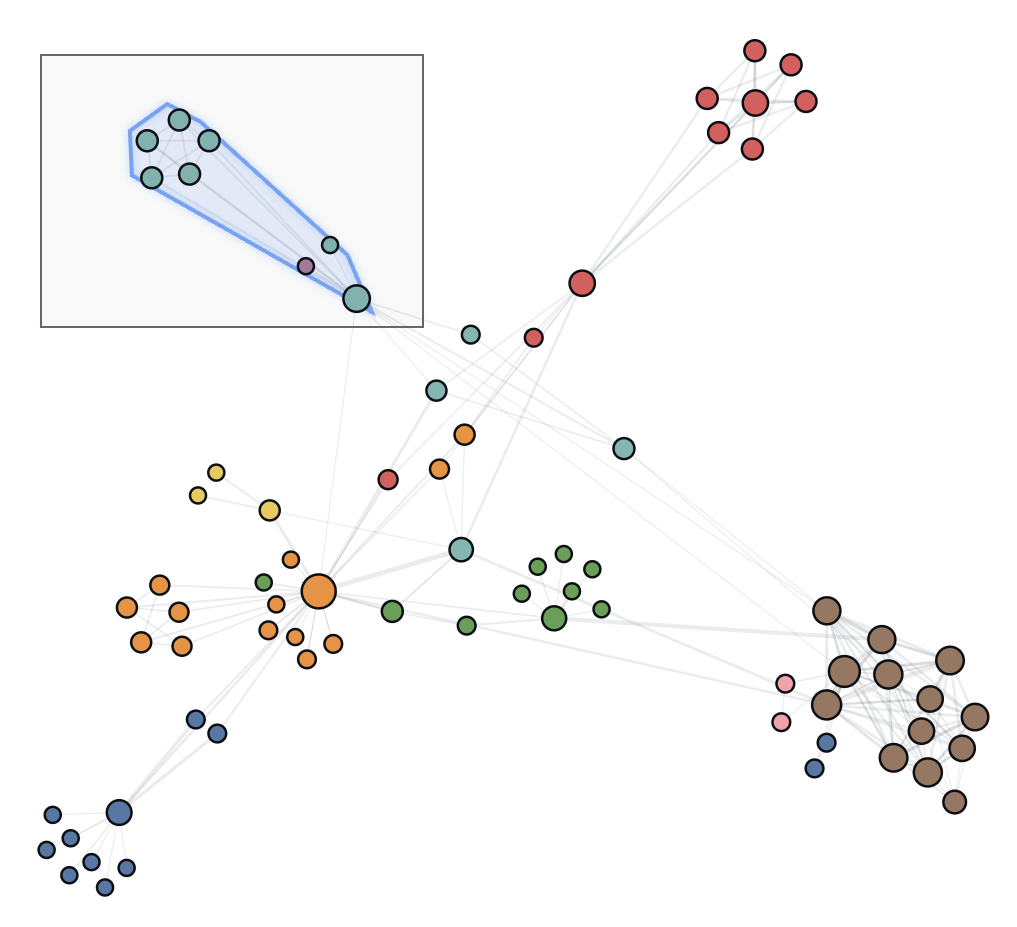
Part 3. Convex Hull
The next step will involve building a convex hull around the nodes selected by the brush. The good news is that D3 offers convex hull calculations through d3.polygonHull. The input to the function are the list 2d points and the output are the points on the hull. You can use these points to draw a polygon with an SVG path. See the d3-polygonHull documentiation.
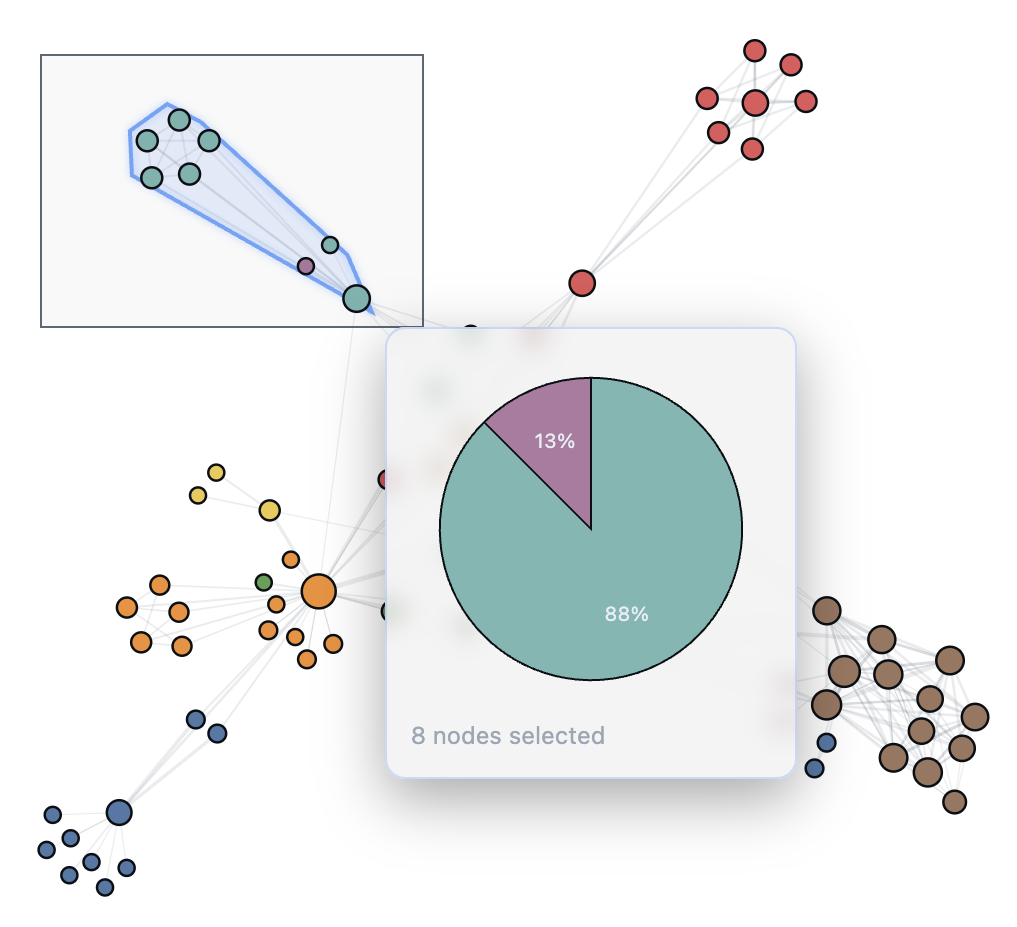
Part 4. Annotating the Selected Group
As the brush selects points, an overlay should appear that include a pie chart of the distribution of the class for the selected points. The template code includes a div that you can use for the popup. It starts hidden and must be shown. Further, the position of it is set with absolute coordinates. See the D3 layouts tutorial for details on how to generate a pie chart.
Part 5. Extra Credit
First, allow for the selections of multiple groups of nodes simulatenuously. Second, allow users to relocate (by dragging) annotated popups. If popups are far away from their associated convex hull, you should find a way to visually connect them (e.g., with a line).
Grading
30% Force-directed layout
20% Brushing
20% Convex hull
30% Popup annotations
10% Extra credit