
D3: Data Driven Documents the Basics
Material based on the D3 Intro by Vadim Ogievetsky, Scott Murray’s Interactive Data Analysis for the Web, and the D3 website.
D3: Data Driven Documents
D3 is a javascript library for manipulating the DOM based on data. D3 was originally written by Mike Bostock, Vadim Ogievetsky, and Jeff Heer and published as a paper at InfoVis, the main information visualization conference. At this point it has a large number of contributors, yet Mike Bostock still is the core developer. It’s also one of the overall most popular projects on GitHub! D3 certainly owes some of its popularity to riding the everything-on-the-web wave. Nevertheless, the way in which you can express relationships between data and visual elements is fundamentally superior than any other library available, open source or not! It is nothing short of a breakthrough in the way we use code to express visual encodings.
D3 can be used to manipulate pure HTML, but most commonly it is used in combination with SVG (i.e., we will be producing SVG charts using D3).
In addition to the introduction in Scott Murray’s book (the mandatory reading) you should work with the D3 API Reference to look up particulars of all the features of D3. And of course, you should be learning by examples. A great collection are Mike Bostock’s blocks (or the new collection on Observable) which contain simple examples, such as a bar chart to complex examples such as this calendar view.
You can download the library to run locally on your computer from the D3 Website, or you can link directly to the latest release with this snippet:
See output in new page.You should also note that D3 underwent a major version change from D3 v3 to D3 v4. Unfortunately, many examples you’ll find on the web will be using version 3. We’ll be using D3 v7, which is a sequence of relatively minor update from D3 v4, in this class. As such, you can’t necessarily expect to just copy and paste example code from the web and expect it to work. Check out the release notes to learn about the changes across the D3 versions.
Selections
Here is a minimal D3 example taken from the D3 website:
See output in new page.You can see that we achieve a similar result to the DOM manipulation examples we had before. We select an existing element in the DOM, here the first <p> element, and apply a style. However, you can also see differences: instead of having to use the API standard document.getElementsByTagName we use d3.select; and instead of using setAttribute("style", "color: steelblue;") we use D3’s style method.
d3.select selects the first element that matches a selector. Selectors can specify tags (p in our example above), classes, and IDs, all through the same interface:
Notice, however, that as mentioned previously, only the first element that matches is selected. Of course, it is more practical to select all elements of a certain type, which we can achieve with d3.selectAll
The last example illustrates the declarative approach of D3: we don’t have to iterate over a list of elements and apply the style. Instead we select a set of elements through rules and declare properties. We didn’t use a loop!
Once you have a selection, you can bulk-modify it’s content, not only in terms of style, but we can modify arbitrary properties using selection.property(name[, value]), the textual content of the elements with selection.text([value]), etc. We can also append elements:
Here is a code snippet that we will use in future examples, included as run.js:
1
2
3
button = d3.select("body").append("button");
button.text("Run!");
button.on("click", execute);
Here we have three SVG rectangles and use selectAll to apply a new style to them. Notice two things:
- the method chaining used to make this convenient to write,
- the use of anonymous functions and the parameters d and i.
- the comparison of explicit anonymous function and the arrow function.
Data
THE key feature of D3 is mapping DOM elements with data. We can do this by calling the data() method on a selection:
D3 binds the data that is passed to a selection directly to the DOM elements. We can see this by logging and/or inspecting the selection.
Here we’ve also used data-driven styling for the first time! By setting the width of the rectangle dynamically to the size of the data item we get a data driven bar chart!
What happens if we have more data points than elements? Let’s try it:
See output in new page.There are still only three elements, it doesn’t matter how many data points we have – we can’t use more than there are elements to select. What to do? enter()! The enter selection holds placeholders for all the data elements that had no corresponding DOM element. We can use this selection to append new elements.
Progress – we have one element for each data item, but it doesn’t look good and it’s not drawn based on data. To fix this, we can apply data-driven attributes to the enter selection as well:
See output in new page.Now, that works! But we’re duplicating code. So instead we can do this shorter version using merge():
So what if we don’t have initialized svg elements at all?
See output in new page.That’s great! D3 can also select things that arn’t there. Sounds strange, but that is very practical. We rarely start with existing DOM elements but mostly want to create them completely in code.
Now let’s explore what happens when we have fewer data items than DOM elements:
See output in new page.We have a similar problem as before. Here, the element that was not bound to data just remains as it was. Fortunately, there is a solution, which is the exit() selection.
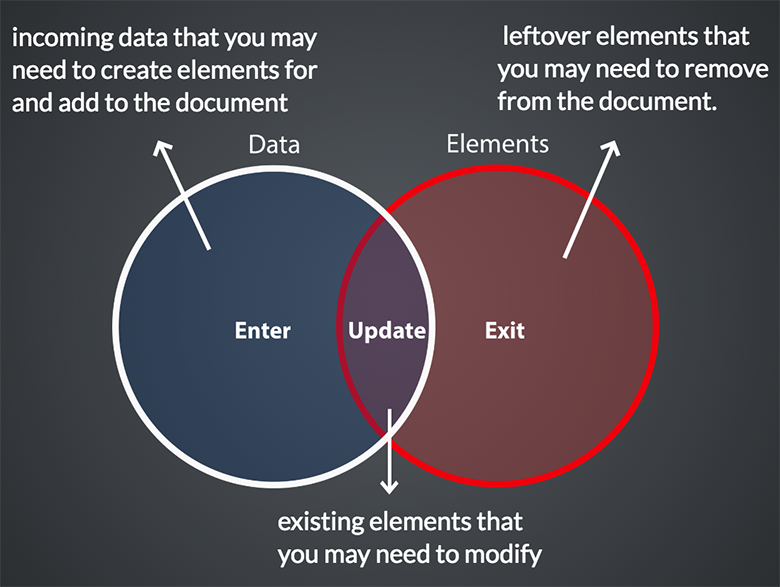
Here is a an illustration showing the differences between the enter, update and exit selection:
D3 V5 – A new way to handle selections and data
The D3 selection API as seen above can be confusing at times. D3 V5 introduces selection.join.
The selection.join statement appends new rect elements for each data item, similar to enter-append statement.
If the selection already has previous elements, the join statement appends entering elements and removes exiting elements to match our data.
Entering and updating elements are also automagically merged!
This is a very concise and still allows you to control enter, update and exit selections as desired. Here we give the enter and the update selection separate colors:
Again, you don’t have to worry about merging enter and update selections, join does it for you!
We now have all the knowledge to select, bind data, react to changes in data. Next, we’ll look at how we can make state changes look great.
Transitions
One of the cool features of D3 is that transitions are baked in!
See output in new page.Cool, but we’re missing the enter again:
See output in new page.Here, we’ve handled the enter and chained two transitions.
Drawing Lines
Here’s one way to draw a line:
See output in new page.But we already know that. There must be something better, and there is!
See output in new page.Exercise
Here is an exercise to practice your D3 skills.